Understanding a scientist’s publication history and trajectory can offer a view into their career journey. It can also be motivational, aspirational, and reassuring, particularly for junior trainees. At present, for a given researcher, Google Scholar makes this hard to do because it lists all publications either chronologically, reverse chronologically, or by most cited, provides few global summary statistics (e.g., h-index), and a single 8-year history of the number of citations. We introduce ScholarTrends, an R Shiny application that produces seven interpretable graphics summarizing a scientist’s entire publication history. This tool adds transparency to a researcher’s trajectory and makes it more accessible to quickly understand a person’s publication trends.
As a leader in outcomes research, Dr. Harlan Krumholz is someone junior scientists may want to emulate. Let us visualize his publication history using ScholarTrends.
A demo video of the application applied to Dr. Krumholz’s profile.
The codebase and instructions for running this application on your local machine are available online (along with an explanation for why a public ScholarTrends webpage is not currently available).
We input Dr. Krumholz’s Google Scholar URL and are greeted with the following plots. Since 2023 publication data is not complete, all visualizations shown here extend till the end of 2022. First, we can plot the number of publications Dr. Krumholz has published each year, and cumulatively. Note that this only considers papers that are indexed on the internet. He published his first paper in 1989. Now, in 2023, he has published nearly 2,500 publications, and for over the past decade, has published a hundred papers each year

Figure 1. Number of indexed publications over time (1989-2022). Displayed are Dr. Krumholz's number of published works (a) and cumulative published works (b) for each calendar year since he first published.
Next, we can visualize the citations Dr. Krumholz’s papers have garnered each year and cumulatively.

Figure 2. Number of citations over time (1989-2022). Displayed are Dr. Krumholz's number of citations (a) and cumulative citations (b) for each calendar year since he first published.
Amongst his published papers, we can understand what fraction of them were lead authorship contributions. About 30% of his lifetime work has been either a first, second, or third author contribution. Nearly 10% of all his publications are first author contributions.

Figure 3. Lead author contributions to published works. Total (left axis) and percent of publications (right axis) where Dr. Krumholz is listed as a 1st to 4th author.
We can visualize the journals in which Dr. Krumholz has most frequently published in during his career. Nearly 400 of his papers have appeared in Circulation, and a major fraction of his articles have been published in cardiology related journals. The journal frequencies follow a power law in which a few journals have a relatively large share followed by a long tail.
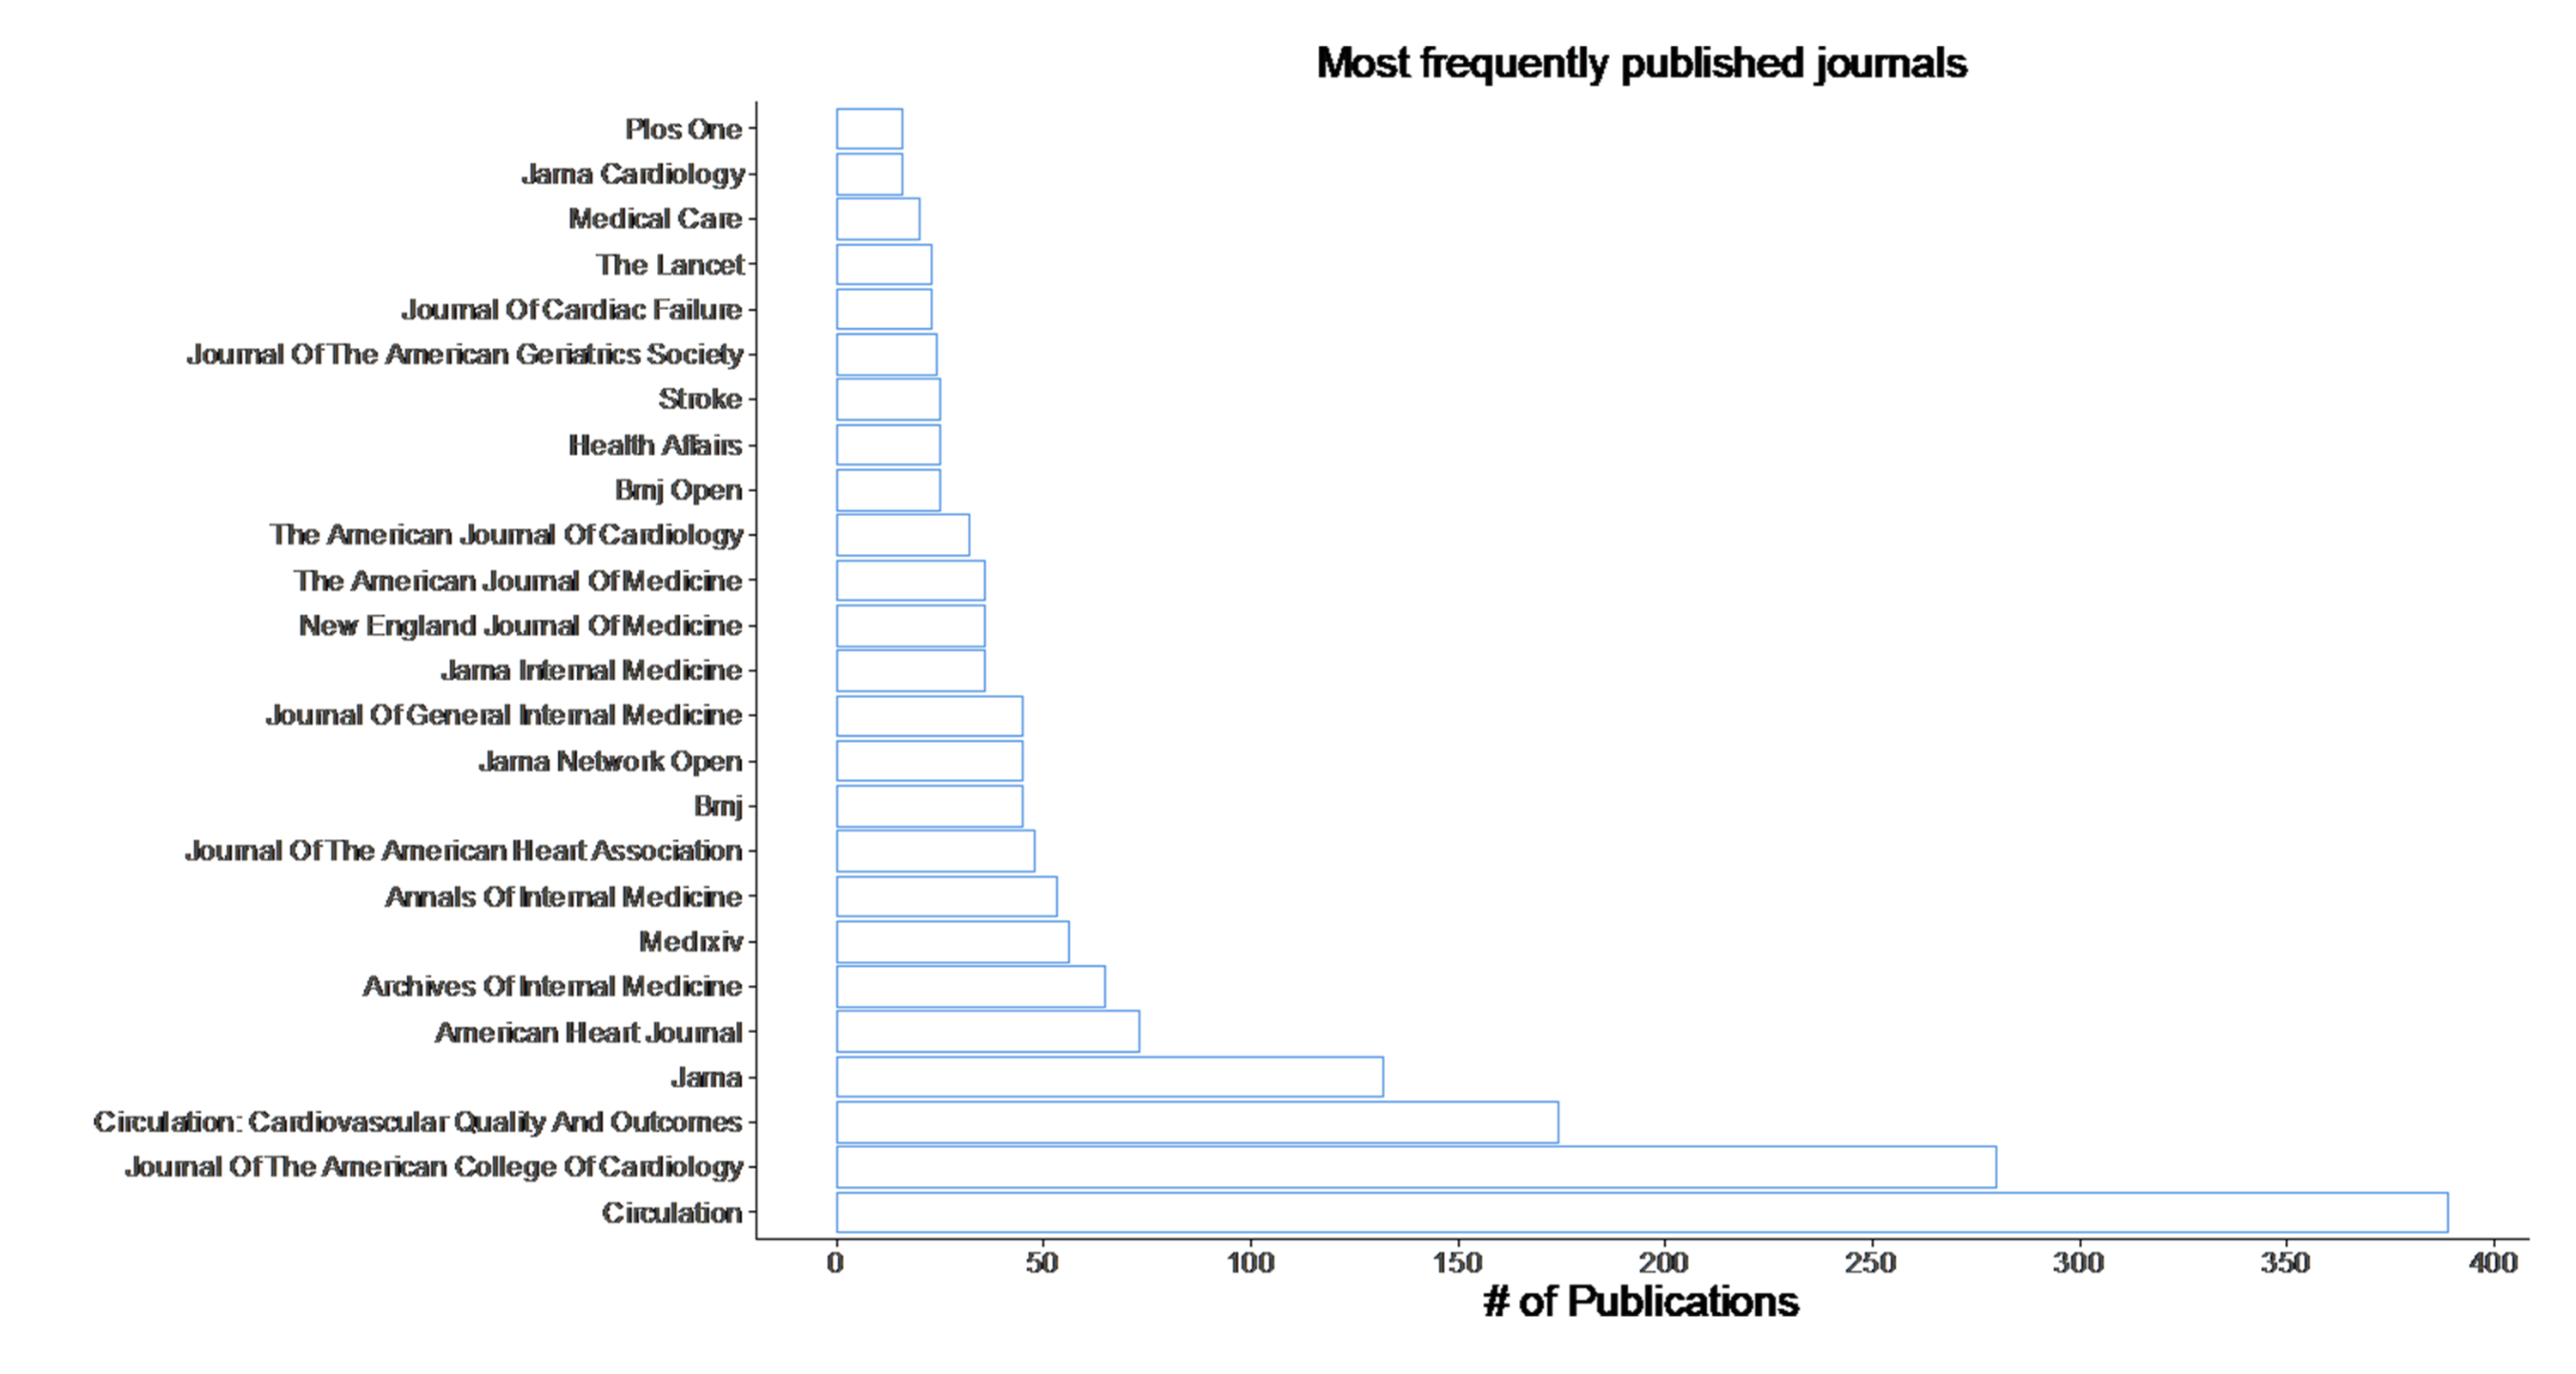
Figure 4. Top 25 most frequently published journals for Dr. Krumholz (1989-2022). Ranked count of the 25 journals in which Dr. Krumholz has most frequently published.
For a more granular view, we can examine the temporal trends of the journals in which Dr. Krumholz’s work has most frequently been published. Since early in his career, Dr. Krumholz has published consistently in Circulation, the Journal of the American College of Cardiology and the Annals of Internal Medicine. On the other hand, he first began publishing in JAMA 6 years after his first paper was published. A more recent trend in his publication history is posting of articles on the preprint server Medrxiv since 2019.
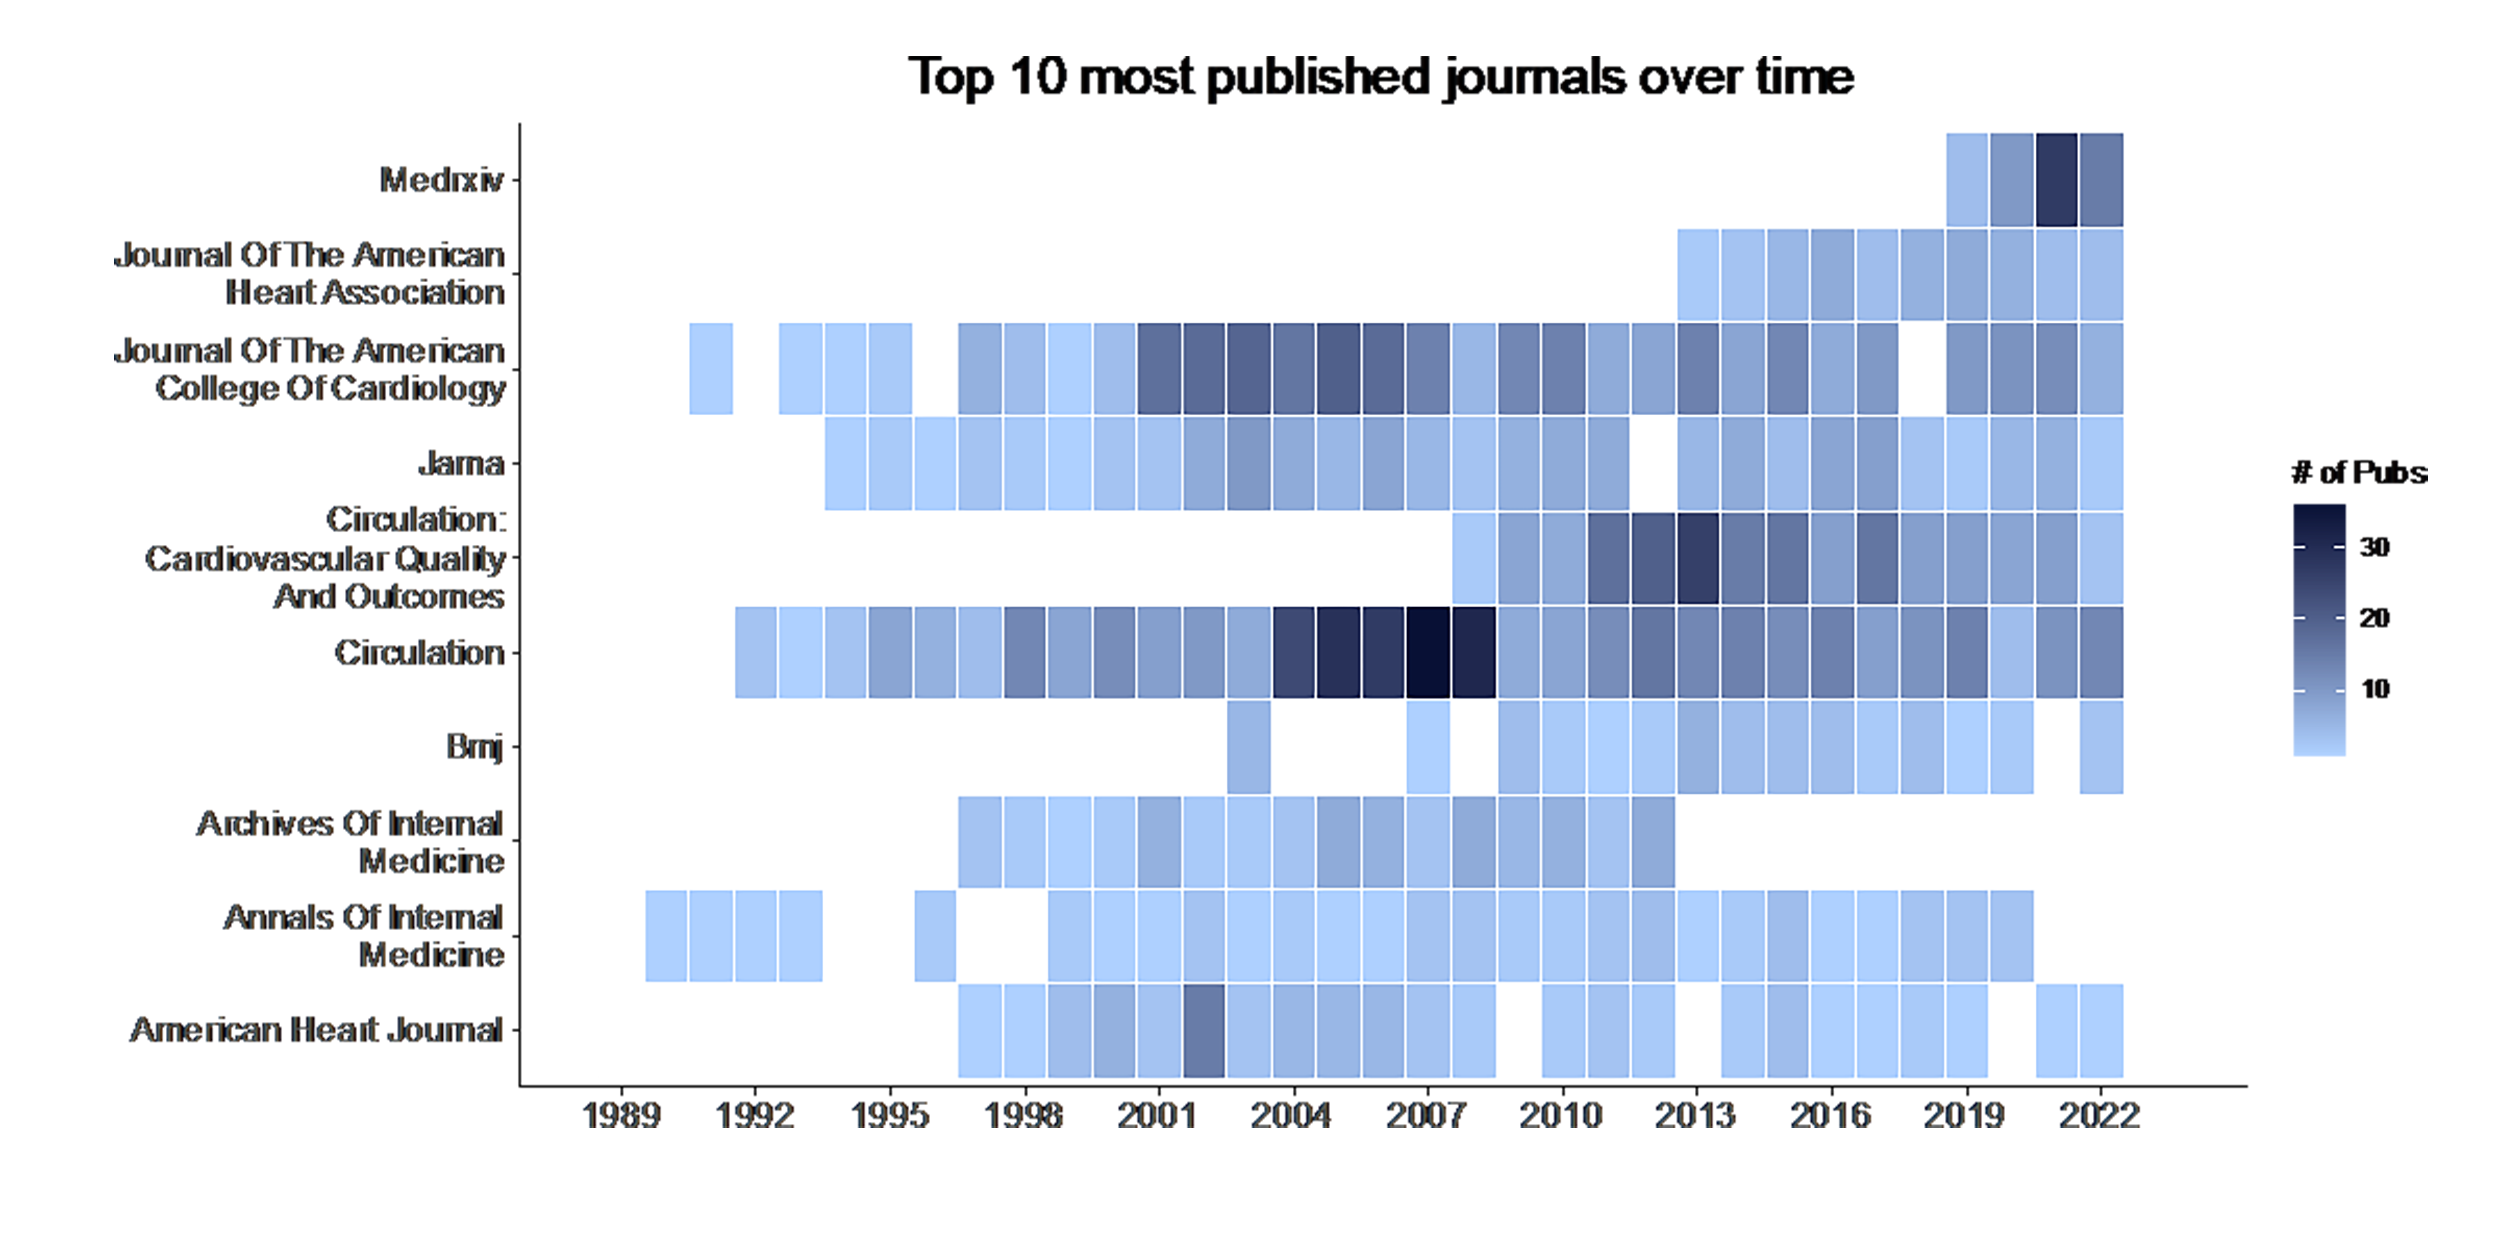
Figure 5. Temporal publication trends of the top 10 journals. Heatmap of the net publication count over time for Dr. Krumholz's top 10 journals’ most frequently published articles.
From the ScholarTrends outputs for Dr. Krumholz, we can gain a few important insights into his career trajectory. First, everyone starts from zero and slowly builds their publications over time. It is often easy to look at the cumulative body of work for someone like Dr. Krumholz (~2500 papers) and forget that it began with one paper. Second, there is a lag between the publication rate and the citation rate, an expected observation. For the first decade of his career, Dr. Krumholz’s papers did not garner much citation attention. Then they did, rather quickly. There is an exponential quality to the cumulative citation graph whereas the cumulative publication rate is more linear.
ScholarTrends can provide high-level insights into the trajectory of researchers’ careers and can be informative to junior researchers trying to build their careers. This tool makes it more accessible to learn about the careers of researchers and their professional journeys. ScholarTrends could also help graduate students better pick mentors that align with their interests. Of course, this is no substitute for direct contact, but students can check whether their potential mentors’ publication histories reflect their interests.
-Adith S. Arun, Yale School of Medicine, New Haven, CT