ASTRA Summary Report Explanation Chart
The ASTRA Summary Report contains information about the calculated molecular weights (MW) as well as collection and processing parameters that were applied during data analysis. The following chart is designed to guide you through the Summary Report (adopted from ASTRA manual; Wyatt Technology). Please note that the Result section presents data for ALL peaks selected for analysis. Peak selection and boundaries are shown on the attached "Peak ID" graph.
Collection Information
This part of the report contains information about data collection, instrument used, type of flow cell in the LS detector and solvent in the mobile phase. The values of the calibration constants used during data processing are shown along with the information regarding mass detector (refractive index or UV) was used to estimate eluted mass:
AUX1: UV detector (which might be used as a mass detector when the extinction coefficient is known)
AUX2: RI detector (might be used as a mass detector when the dn/dc value is known) Flow rate used during SEC run is also shown.
Processing Information
This part of the report refers to the fitting method that was used by ASTRA to carry out the molecular mass determination.
Processing Time
date and time of processing
Fit method/model:
Calculation Method:
Detectors Used:
Results
This section summarizes the molecular weight calculations for each peak selected (please refer to attached "Peak ID" graph for peak identification).
Volume:
Slices:
A2:
Fit Degree:
Injected Mass:
Calc. Mass:
dn/dc value:
(dn/dc is the refractive index increment of the solute).
Polydispersity (Mw/Mn):
Molar Mass Moments (g/mol)
Mn: Number-average molar mass defined as:

Mn is the molar mass (or molecular weight, MW); this might for instance be measured by osmometry.
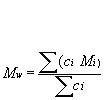
Mw: Weight-average molar mass is defined as:

Mw is the molar mass (or molecular weight, MW); this might for instance be measured by light scattering method.
Mz: Z-average molar mass is defined as:

Mz is the molecular weight (MW); this might for instance be measured during sedimentation analysis.
R.M.S. Radius Moments (nm)
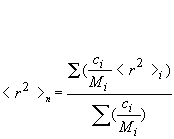
Rn: number-average mean square radius calculated as:

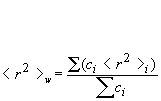
Rw: weight-average mean square radius calculated as:

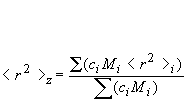
Rz: z-average mean square radius calculated as:
Note:The method for data analysis, namely, Zimm/Debye/Berry/random coil plot describes the algorithm employed by ASTRA for processing data for each individual slice. Technically, the molar mass calculated for each slice from either of the fits (Zimm/Debye/Berry/random coil plot) is weight-averaged and the radius is z-averaged. These masses/radii can be used together with the concentration ci (measured with the concentration sensitive detector, UV or RI, for each slice) to find the average mass for the entire peak.
Molar masses, Mn, Mw and Mz
, and radius moments, Rn, Rw and Rz, represent average values obtained using different averaging formulas. The summations are performed over one peak. Please note that light scattering can be used to estimate size/radius of objects that are of the size that correspond to at least 1/20th of the incident light. ForDAWN-DSP
instrument the laser wavelength is 633 nm. Thus, radii smaller then ~ 20 nm cannot be estimated reliably.The errors represent ONLY the statistical consistency of the data and do not provide an absolute error for the analysis. The sources of errors that are not accounted for are, for example, uncertainty in the dn/dc value, calibration constants or normalization coefficients.
Calculation of MW by ASTRA
In general, ASTRA is solving the following equation that relates the excess scattered light to the concentration and weight-average molar mass:
where:
R(Q) is the excess intensity of scattered light at DAWN angle Q
c is the sample concentration
Mw is the weight-average molecular weight
A2 is a second virial coefficient
K* is an optical parameter equal to 4p2n2 (dn/dc)2 / (lo4NA)
n is the solvent refractive index and dn/dc is the refractive index increment
NA is Avogadro’s number
lo is the wavelength of the scattered light in vacuum.
The function P(Q) describes the angular dependence of scattered light.
The expansion of 1/ P(Q) to first order gives:
1/ P(Q) = 1 + (16p2/3l2) <rg2>. sin2(Q/2) + f4 sin4(Q/2) +...
There are several ways in which Eq. (1) (that relates excess of scattered light to concentration and weight-average molar mass) can be solved to get Mw and <rg2>. The parameter "Fit method/model" refers to the actual method applied.
Debye Fit Method:
constructs a plot of R(Q)/K*c vs. sin2(Q/2) and fits a polynomial in sin2(Q/2) to the data, thereby obtaining Mw and <rg2> from the intercept and slope at zero angle (the order of polynomial used during fitting is given in the RESULT section as "FIT DEGREE").
It gives good results over a wider range of molecular weight as compared to the Zimm formalism.
Zimm Fit Method:
constructs a plot of K*c/R(Q) vs. sin2(Q/2) and fits a polynomial in sin2(Q/2) to the data, thereby obtaining Mw and <rg2> from the intercept and slope at zero angle (the order of polynomial used during fitting is given in the RESULT section as "FIT DEGREE").
This is the most popular method for analysis of light scattering data. It works well for mid-sized molecules (rms radius up to ~20-50 nm).
Berry Fit Method:
constructs a plot of SQRT{K*c/R(Q)} vs. sin2(Q/2) and fits a polynomial in sin2(Q/2) to the data (the order of polynomial used during fitting is given in RESULT section as "FIT DEGREE."
Useful for large molecules.
Random Coil Method:Eq. (1) is solved after inserting the theoretical form factor P(Q) for random coils given by:
where u = (4p/l)2<r2>sin2(Q/2).
P(Q) is a nonlinear function of <r2>, an iterative nonlinear least square fit is used during fitting. This fitting method might be advantageous for large random coil molecules (the order of polynomial used during fitting is given in RESULT section as "FIT DEGREE").
Please note that all the above methods will give nearly identical results for small molecules (rms radius <10nm). Thus, any of the fitting formalisms can be used interchangeably for proteins with MW <1x10⁶ Da.
