Population Activity in Vertebrate Brains
Population Signals
When a low magnification objective is used to form an image of a vertebrate preparation in an ordinary light microscope, each pixel of the camera receives light from hundreds or thousands of neurons and processes. Now, the signals are the population average of the membrane potential or calcium concentration changes in those neurons. These population signals monitor coherent activity, i.e. those events that involve simultaneous changes in activity of some of the neurons in the imaged region.
Odorant elicited activity in the turtle and mouse olfactory bulbs
We made maps of the input to the olfactory bulb. We stained the olfactory receptor neurons in the nose with Calcium Green - dextran and waited for several days to allow the dye to be transported to the receptor nerve terminals in the olfactory bulb. In in vivo measurements we applied odorant stimuli to the nose and measured the changes in calcium concentration in the receptor neuron nerve terminals in the olfactory bulb glomeruli.
Turtle
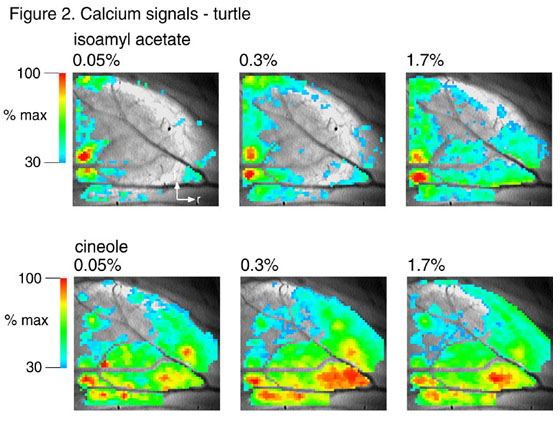
What happens when the odorant concentration is changed? The results in Figure 2 show the maps for two odorants at three different concentrations. The top row is isoamyl acetate and the bottom is cineole. Again, the maps of activity are different for the two odorants. In addition, the maps remain consistently different over this substantial concentration range. Thus, the turtle could recognize odorants in a concentration invariant way just by reading the maps of input. Others have speculated that piriform cortex is organized as an association cortex and thus could have the role of map reader.
Mouse
The results of similar experiments in the mouse are different. In the mouse the maps change with odorant concentration; more glomeruli are activated with increasing concentration. Figure 3 shows (now using a gray scale) the responses to two concentrations of two odorants, hexanone and butanone. The left panels show that at the low concentration the odorants activated only a small number of glomeruli. At the high concentration (right panels) the odorants activated many more glomeruli. Thus, the maps in the mouse are not concentration invariant at the level of the input to the bulb. Processing must be needed to generate concentration invariance.
Future plans
References
Storace, D.A. and Cohen, L.B. (2016) A contribution of the olfactory bulb to odor perception: the input-output transformation. Submitted.
Homma, R., L. B. Cohen, E. K. Kosmidis and S. L. Youngentob. (2009) Perceptual stability during dramatic changes in olfactory bulb activation maps and dramatic declines in activation amplitudes. European J. Neuroscience, 29: 1027-1034. PMC2762425
Eugenin, J., Nicholls, J. G., Cohen, L.B., and Muller K., (2005) Optical recording from respiratory pattern generator of foetal mouse brainstem reveals a distributed network.Neuroscience,137: 1221-1227..
Spors, H., Wachowiak, M., Cohen, L.B., and Friedrich, R.W. (2006) Temporal dynamics and latency patterns of receptor neuron input to the olfactory bulb.J. Neuroscience, 26: 1247-1259.
Vucinic, D., Cohen, L.B., and Kosmidis, E.K. (2006) Presynaptic centre-surround inhibition shapes odorant evoked input to the mouse olfactory bulb in vivo.J. Neurophysiology, (2006) 95:1881-1887.
Zochowski, M. R., and Cohen, L. B. (2005), Oscillations in the olfactory bulb carry information about the history of odorant presentation.J.Neurophysiology, 94: 2667-2675.
Wachowiak, M, and Cohen, L.B. (2003) Correspondence between odorant-evoked patterns of receptor neuron input and intrinsic optical signals in the mouse olfactory bulb.J. Neurophysiology, 89: 1623-1639.
Ying-wan Lam, Lawrence B. Cohen, and Michal R. Zochowski (2003) Effect of odorant quality on the three oscillations and the DC signal in the turtleolfactory bulb.European J. Neuroscience, 17: 436-446.
Wachowiak M, Cohen LB, and Zochowski, M. R. (2002) Distributed and concentration invariant spatial representations of odorants by receptor neuron input to the turtle olfactory bulb.J. Neurophysiology, 87: 1035-1045.
Wachowiak, M. and Cohen, L.B. (2001) Representation of odorants by receptor neuron input to the mouse olfactory bulb.Neuron, 32: 723-735.
Ying-wan Lam, Lawrence B. Cohen, Matt Wachowiak, and Michal R. Zochowski (2000) Odors elicit three different oscillations in the turtle olfactory bulb.J. Neuroscience, 20:749-762.
Wachowiak, M., Zochowski, M., Cohen, L.B., and Falk, C. X. (2000) The spatial representation of odors by olfactory receptor neuron input to the olfactory bulb is concentration invariant.Biological Bulletin, 199: 162-163.
Wachowiak, M. and Cohen, L.B. (1998) Presynaptic afferent inhibition of lobster olfactory receptor cells: Reduced action potentialpropagation into axon terminals.J. Neurophysiology, 80, 1011-1015.
Ying-wan Lam, Lawrence B. Cohen, Matt Wachowiak, and Michal R.Zochowski (2000) Odors elicit three different oscillations in the turtle olfactory bulb.J. Neuroscience, 20:749-762.
Wachowiak, M., and Cohen, L. B. (1999) Presynaptic inhibition of primary olfactory afferents mediated by different mechanisms in the lobster and turtle.J. Neuroscience, 19, 88088817.
Prechtl, J.C., L.B. Cohen, B. Pesaran, P.P. Mitra, and D. Kleinfeld (1997) Visual stimuli induce propagating waves of electrical activity in the turtle cortex.,Proc Nat Acad Sci (USA), 94, 7621-7626.
London, J.A., L.B. Cohen, and J.Y. Wu (1989) The spread of epileptiform discharges in the somatosensory cortex of the rat measured with voltage sensitive dyes.J Neuroscience, 9, 2182-2190.
Kauer, J.S., D.M. Senseman, and L.B. Cohen (1987) Odor elicited activity monitored simultaneously from 124 regions of the salamander olfactory bulb using a voltage sensitive dye.Brain Res,, 418, 255-261.
Orbach, H.S., L.B. Cohen, and A. Grinvald (1985) Optical mapping of electrical activity in rat somatosensory and visual cortex.J Neuroscience, 5, 1886-1895.