HPLC Size Exclusion Chromatography/Laser Light Scattering Determination of Native Protein Molecular Weights
SEC-LS Report for BSA
Please find enclosed the data that resulted from the analysis carried out on your sample of BSA submitted on April 13, 1998.
The sample was run April 14th and the results are saved in file BSA0414A. The molecular weight (MW) was calculated using FINDLINK the ASTRA software. In the Astra approach, the MW is determined by solving the equation that relates the excess scattered light, measured at several angles, to the concentration of protein and the weight-average molar mass. The results are summarized in Table 1.
Table 1: Results of SEC-LS analysis for run BSA0414A
|
|
|
|
disperse peak?* |
|
||
|
|
(ml) |
|
|
|||
| BSA0414A |
|
~12.8 |
|
|
|
<8% of total A280 |
| BSA0414A |
|
~13.8 |
|
|
|
|
| BSA0414A |
|
~15.5 |
|
|
|
|
* A monodisperse peak is a peak that contains one type of molecule of defined MW (e.g., pure monomeric protein). The peak is thus homogenous with respect to MW. In the case of a monodisperse peak, the average molar mass will be independent of the averaging method used and polydispersity will equal to 1. If the peak contains a mixture of species of different molar masses (polydisperse peak; for example, a mixture of dimer [or tetramer] and monomer) the weight average molecular weight, Mw, will vary across the eluting peak and the average mass (for the entire peak) will change depending on the averaging method and polydispersity will be greater then 1.a calculated from propagation of errors from calibration curve used and from noise in the LS and RI signal
Conclusions
The important findings from the SEC-LS/RI/UV analysis of BSA include:
- the BSA sample elutes as three peaks from the gel filtration column under the buffer conditions used during the chromatography (i.e., 20 mM HEPES, 100 mM KCl, 1 mM EDTA, pH=8.0) [see UV traces on Strip Chart View(BSA letter)>Strip Chart View Plot].
- the molecular weight of BSA protein in the eluting peaks is estimated as ~215 kDa for the smallest peak (<8% total mass), 139 kDa for the minor peak (~19% of total mass) and 66 kDa for the major peak (73% of total mass) indicating that, under conditions used during the chromatography, the BSA sample was a mixture of a monomer and dimer with a small amount of higher order aggregates [Summary report from ASTRA].
- the weight average MW for the monomer and dimer peaks does not depend on protein concentration indicating that these peaks were monodisperse, i.e., contained one type of molecule of defined MW (homogeneous with respect to MW [see Distribution of Molar Mass].
The detailed report consists of the following pages:
- Stip Chart View Plot with UV/RI and LS traces (peaks analyzed by "two detector" method are marked on UV trace).
- "Peak ID PLOT (BSA letter)"that contains superimposed signals from UV (AUX1; blue), RI (AUX2; green) and LS (signal from 90° detector; red) detectors (please note that the large LS signal at ~9 mL arises from "dust" impurities in the sample/injector. Since the RI signal indicates this LS peak does not have any significant mass associated with it, this LS peak may be ignored, the "negative/positive peaks" in the RI signal at the end of the run arise from salts/air in the injected sample).
- Summary report from ASTRA software (plus an ASTRA Summary Report Explanation Chart).
- Example of strong>Debye/Zimm plot for a selected slice (maximum of the peak).
- Plot of Distribution of Molar Mass vs. elution time.
Comments
File BSA0414A: 100 mg loaded.
As indicated on the UV trace shown on Strip Chart View Plot, your sample eluted from the gel permeation column in three peaks with the maxima at ~12.8 mL (peak #1), 13.8 mL (peak #2) and 15.5 mL (peak #3; major peak). The mass distribution between these peak was: the major peak that eluted at ~15.5 mL contained ~73 % of the total eluted mass, the minor peak that eluted at ~ 13.8 mL represented ~19 % of the total mass and the smallest peak (~12.8 mL) contained less then 8 % of the total eluted mass.
Peak ID Plot indicates the boundaries of the peaks that were selected for molecular mass calculations using the ASTRA software. The molecular masses calculated from the Debye Plot are presented in the Summary report from ASTRA as Mn (number average molar mass), Mw (weight average molar mass) and Mz (z-average molar mass; see Molar Mass Moments in ASTRA Summary Report Explanation Chart for details). The average molecular weight was estimated as 215 kDa for peak #1, 137 kDa for peak #2 and 65.6 kDA for peak #3. There was no variation in the molecular weight across peak #3 (see plot of Distribution of Molar Mass vs. elution time) indicating this peak was homogenous with respect to MW and contained only a monomer of BSA protein. The MW for slices across peak #2 range from 130 kDa to 150 kDa indicating this peak contained a dimer of your protein that was separated from the monomer during gel permeation (see plot of Distribution of Molar Mass vs elution time). This peak has not been fully separated from peak #1 and the estimated Mw is elevated at the regions where the peaks are overlapping (due to the fact that light scattering is measuring Mw, the weight average molecular weight of all the species present in solution). Peak #1 is clearly a polydisperse peak that contained a mixture of different oligomers with the Mw varying from 190 kDa to 240 kDa within the boundaries of the peak (see plot of Distribution of Molar Mass vs. elution time).
The molecular weights determined by both analyses, i.e. "two detector" method and ASTRA analysis, are in good agreement (see Table 1).
Peak ID Plot
AUX1 = UV signal (absorbance at 280 nm; blue)
AUX2 = RI signal (refractive index changes; green)
90° Detector = LS trace recorded for the detector at 90° angle
(highest scattering signal; red)
(please note that the RI and UV signals are scaled to LS signal)
Vertical lines indicate boundaries of peak/peaks selected for ASTRA analysis
ASTRA 4.70.04 (Beta #4) summary Report for BSA0414A
File : C:\WTC\ASTRA450\RUNS3-~1\BSA0414A.ADF
Sample ID : BSA 100 ug in100 ul (750 loop) 20 mM HEPES, KCl 100mM, 1 mM EDTA pH=8.0
Operator : Ewa
Collection Information
Collection time : Tue Apr 14, 1998 12:49 PM
Instrument type : DAWN DSP
Cell type : K5
Laser wavelength : 632.8 nm
Solvent name : water
Solvent RI : 1.332
Calibration constants
DAWN : 3.0090e-05
"AUX2" : 2.1093e-04
Flow rate : 0.400 mL/min
PROCESSING INFORMATION
Processing time : Wed May 27, 1998 01:24 PM
DAWN/AUX2 delay : 0.130 mL
Fit method / model : Debye
Calculation method : dn/dc + AUX Constant
Detectors used : 6 7 8 9 10 11 12 13 14 15 16
RESULTS
| PEAK #1 | PEAK #2 | PEAK #3 | |
| Volume (mL) : | 12.650 - 13.220 | 13.620 - 14.313 | 15.127 - 16.483 |
| Slices : | 172 | 209 | 408 |
| A2 (mol mL/g) : | 0.000e+00 | 0.000e+00 | 0.000e+00 |
| Fit degree : | 1 | 1 | 1 |
| Injected Mass (g) : | 0.0000e+00 | 0.0000e+00 | 0.0000e+00 |
| Calc. Mass (g) : | 4.7522e-06 | 1.3333e-05 | 7.5068e-05 |
| dn/dc (mL/g) : | 0.184 | 0.184 | 0.184 |
| Polydispersity(Mw/Mn) : | 1.003±0.026 | 1.001±0.015 | 1.000±0.010 |
| Polydispersity(Mz/Mn) : | 1.005±0.045 | 1.002±0.026 | 1.001±0.017 |
| Molar Mass Moments (g/mol) |
| Mn : |
2.149e+05 (1.8%)
|
1.365e+05 (1.0%) | 6.558e+04 (0.7%) |
| Mw : |
2.154e+05 (1.8%)
|
1.366e+05 (1.1%) | 6.561e+04 (0.7%) |
| Mz : |
2.160e+05 (4.0%)
|
1.367e+05 (2.4%) | 6.563e+04 (1.5%) |
| R.M.S. Radius Moments (nm) |
| Rn : |
4.6 (190%)*
|
5.1 (111%) | 3.7 (161%) |
| Rw : | 4.8 (176%) | 5.3 (103%) | 3.8 (150%) |
| Rz : | 5.0 (176%) | 5.5 (103%) | 3.9 (150%) |
* Please note that light scattering can be used to estimate size/radius of objects that are of the size that correspond to at least 1/20th of the incident light.
Debye Plot BSA0414A
Upper panel:
- Debye plot: a plot of R(theta)/ K*c vs sin2 (theta /2) and fit of a polynomial into the data to obtain the Mw from the intercept and radius from the slope at zero angle (see for more details)
Lower panel:
- RI and LS traces with the peak boundaries marked by vertical lines; the short vertical mark "|" on the traces indicates the slice for which the Debye plot is shown.
Molar Mass Distribution Plot
The solid line/lines indicates the trace from RI detector while "dots" are Mw determined for each slice, i.e., every 3.3 microliter of the elution volume.
ASTRA Summary Report Explanation Chart
The ASTRA Summary Report contains information about the calculated molecular weights (MW) as well as collection and processing parameters that were applied during data analysis.
The following chart is designed to guide you through the Summary Report (adopted from ASTRA manual; Wyatt Technology). Please note that the Result section presents data for ALL peaks selected for analysis. Peak selection and boundaries are shown on the attached "Peak ID" graph.
Collection Information
This part of the report contains information about data collection, instrument used, type of flow cell in the LS detector and solvent in the mobile phase.
The values of the calibration constants used during data processing are shown along with the information regarding mass detector (refractive index or UV) was used to estimate eluted mass:
AUX1: UV detector (which might be used as a mass detector when the extinction coefficient is known)
AUX2: RI detector (might be used as a mass detector when the dn/dc value is known)
Flow rate used during SEC run is also shown.
Processing Information
This part of the report refers to the fitting method that was used by ASTRA to carry out the molecular mass determination
- Processing time: date and time of processing
-
Fit method/model: refers to the choice of fitting method
-
Calculation Method: provides information relating to how the eluted mass was estimated (for each individual slice):
dn/dc value + AUX constant: means that the known dn/dc was used along with the AUX detector reading. Alternatively, the total injected mass can be used with the assumption of 100% recovery of that mass within the analyzed peak value (dn/dc is a refractive index increment of the solute, which usually means the increase in refractive index with protein concentration). - Detectors used: the subset of signals from LS detectors used in the analysis (there is a total of 18 detectors in the DAWN instrument but for aqueous solutions the signal from lower angle detectors, i.e. detectors #3-6 and #16-18, is very noisy and for some samples these readings may be deleted during data processing)
Results
This section summarizes the molecular weight calculations for each peak selected (please refer to attached "Peak ID" graph for peak identification).
-
Volume: indicates the boundaries for the selected peak (in mL or elution time)
-
Slices: refers to number of slices for which the MW is calculated (within the peak of interest)
-
A2: value of second virial coefficient used during the analysis. The value of the second viral coefficient is negligible at the low concentrations used during chromatographic applications.
-
Fit Degree: degree of polynomial function used during the fitting protocol (1 means linear function)
-
Injected Mass: used for mass estimation if a total injected mass is used instead of depending upon the "dn/dc value + AUX constant" method
-
Calc. Mass: indicates the mass estimated by ASTRA within the boundaries of the particular peak
-
dn/dc value: dn/dc value used for mass calculation using the RI detector signal (dn/dc is the refractive index increment of the solute).
- Polydispersity (Mw/Mn): indicates whether the peak is homogenous with respect to molar mass. A homogeneous (i.e., monodisperse) sample is one that contains only one type of molecule of defined MW (e.g. pure monomeric protein), thus the average mass is independent of the averaging method and polydispersity will equal 1. If the sample contains a mixture of species of different molar masses (i.e., polydisperse sample; for example, a mixture of dimer or tetramer and monomer) the average mass will depend on the averaging method and the polydispersity will be different from 1.
Molar Mass Moments (g/mol)
Mn: Number-average molar mass defined as:
Mn is the molar mass (or molecular weight, MW); this might for instance be measured by osmometry.
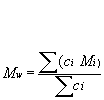
Mw: Weight-average molar mass is defined as:
Mw is the molar mass (or molecular weight, MW); this might for instance be measured by light scattering method.
Mz: Z-average molar mass is defined as:
Mz is the molecular weight (MW); this might for instance be measured during sedimentation analysis.
R.M.S. Radius Moments (nm)
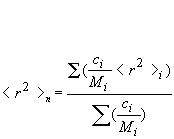
Rn: number-average mean square radius calculated as:
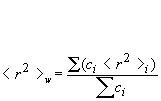
Rw: weight-average mean square radius calculated as:
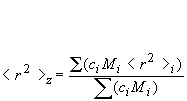
Rz: z-average mean square radius calculated as:
NOTE:The method for data analysis, namely, Zimm/Debye/Berry/random coil plot describes the algorithm employed by ASTRA for processing data for each individual slice. Technically, the molar mass calculated for each slice from either of the fits (Zimm/Debye/Berry/random coil plot) is weight-averaged and the radius is z-averaged. These masses/radii can be used together with the concentration ci (measured with the concentration sensitive detector, UV or RI, for each slice) to find the average mass for the entire peak.
Molar masses, Mn, Mw and Mz
, and radius moments, Rn, Rw and Rz, represent average values obtained using different averaging formulas. The summations are performed over one peak. Please note that light scattering can be used to estimate size/radius of objects that are of the size that correspond to at least 1/20th of the incident light. ForDAWN-DSP
instrument the laser wavelength is 633 nm. Thus, radii smaller then ~ 20 nm cannot be estimated reliably.The errors represent ONLY the statistical consistency of the data and do not provide an absolute error for the analysis. The sources of errors that are not accounted for are, for example, uncertainty in the dn/dc value, calibration constants or normalization coefficients.
Calculation of MW by ASTRA
In general, ASTRA is solving the following equation that relates the excess scattered light to the concentration and weight-average molar mass:
where:
R(Q) is the excess intensity of scattered light at DAWN angle Q
c is the sample concentration
Mw is the weight-average molecular weight
A2 is a second virial coefficient
K* is an optical parameter equal to 4p2n2 (dn/dc)2 / (lo4NA)
n is the solvent refractive index and dn/dc is the refractive index increment
NA is Avogadro’s number
lo is the wavelength of the scattered light in vacuum.
The function P(Q) describes the angular dependence of scattered light.
The expansion of 1/ P(Q) to first order gives:
1/ P(Q) = 1 + (16p2/3l2) <rg2>. sin2(Q/2) + f4 sin4(Q/2) +...
There are several ways in which Eq. (1) (that relates excess of scattered light to concentration and weight-average molar mass) can be solved to get Mw and <rg2>. The parameter "Fit method/model" refers to the actual method applied.
Debye Fit Method:
constructs a plot of R(Q)/K*c vs. sin2(Q/2) and fits a polynomial in sin2(Q/2) to the data, thereby obtaining Mw and <rg2> from the intercept and slope at zero angle (the order of polynomial used during fitting is given in the RESULT section as "FIT DEGREE").
It gives good results over a wider range of molecular weight as compared to the Zimm formalism.
Zimm Fit Method:
constructs a plot of K*c/R(Q) vs. sin2(Q/2) and fits a polynomial in sin2(Q/2) to the data, thereby obtaining Mw and <rg2> from the intercept and slope at zero angle (the order of polynomial used during fitting is given in the RESULT section as "FIT DEGREE").
This is the most popular method for analysis of light scattering data. It works well for mid-sized molecules (rms radius up to ~20-50 nm).
Berry Fit Method:
constructs a plot of SQRT{K*c/R(Q)} vs. sin2(Q/2) and fits a polynomial in sin2(Q/2) to the data (the order of polynomial used during fitting is given in RESULT section as "FIT DEGREE."
Useful for large molecules.
Random Coil Method:Eq. (1) is solved after inserting the theoretical form factor P(Q) for random coils given by:
where u = (4p/l)2<r2>sin2(Q/2).
P(Q) is a nonlinear function of <r2>, an iterative nonlinear least square fit is used during fitting. This fitting method might be advantageous for large random coil molecules (the order of polynomial used during fitting is given in RESULT section as "FIT DEGREE").
Please note that all the above methods will give nearly identical results for small molecules (rms radius <10nm). Thus, any of the fitting formalisms can be used interchangeably for proteins with MW <1x10⁶ Da.


